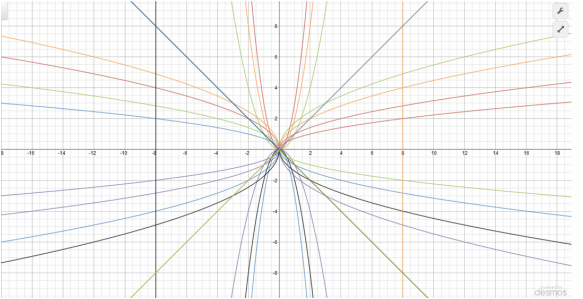
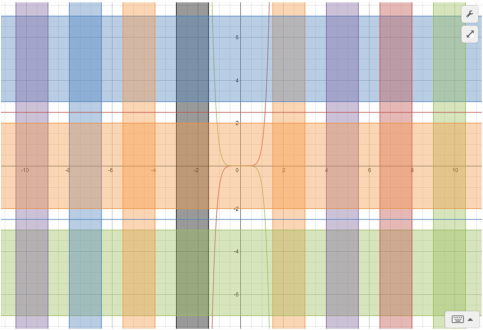
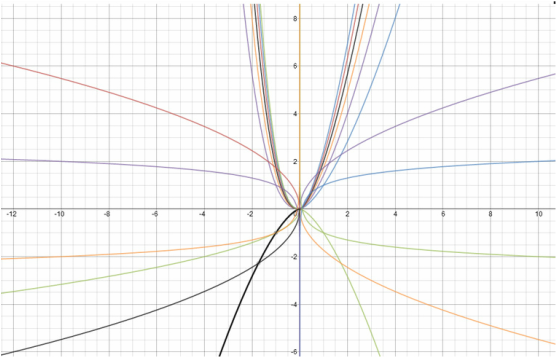
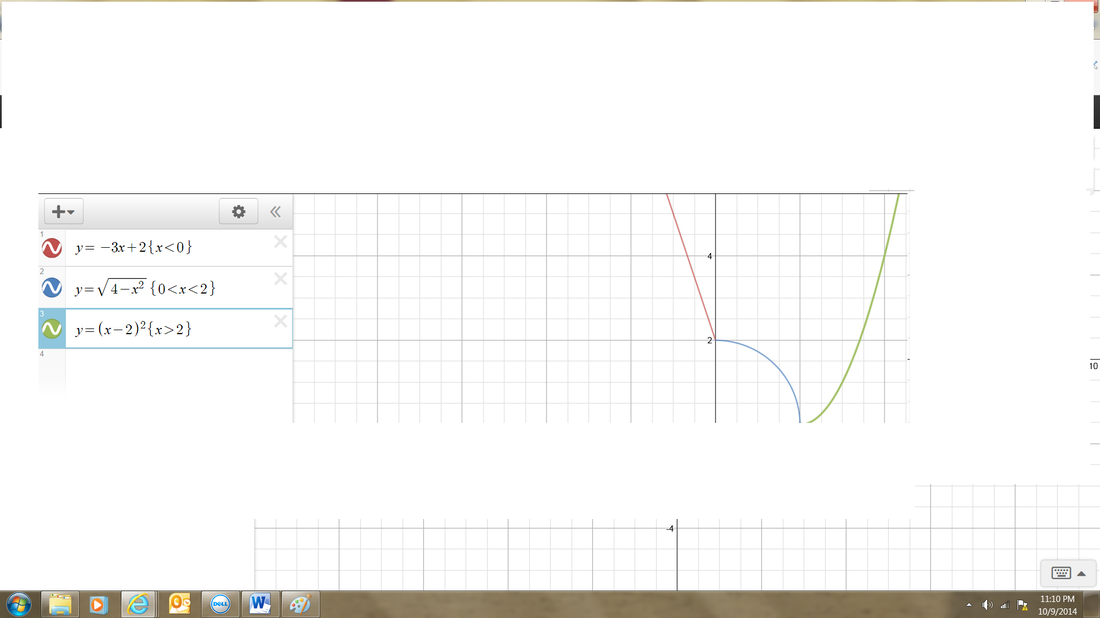
In my newest 3 Desmos art graphs i used the knowledge i gained of graphs to make my art better than my first one at the beginning of the trimester. On the first graph i used many different functions where i changed the power of x and also made them negative to make a cool design. In my second graph i used x is greater or equal to as well as less than or equal to to form a colorful less complex graph. I also used y to get the horizontal color on the graph. And on my last graph i used the square root of different values of x to get the swoop like lines on the graph, i mixed those lines around by adding negatives throughout the functions. Another thing i added to the graph was logarithms to get the longer swoops that go through two quadrants of the graph, where i also added negatives to those to get different effects and put them in different quadrants.
0 Comments
1. Types of Student Loans
A. Direct Subsidized B. Direct Unsubsidized C. Direct PLUS 2. Terms and Interest Rates A. Interest Rate 4.66%- only available to 4 Yr. student B. Interest Rate 4.66%- Available to Parents and 4 Yr. C. Interest Rate 7.21%- Available to Grad School, 4 Yr. and Parents You don't need a cosigner to be able to remove student loans, however you must actually be in need of a student loan to be able to apply for one. The individual who signed on the loans is responsible for repaying them. 3. How is interest Calculated ? Interest is calculated with the formula A=P(1+r)^t 4. How is interest Compounded? Interest is compounded monthly, in order to lower the overall price of the students complete debt at the end of college. 5. When is the interest Accumulated? Interest gets accumulated when the student has graduated college to make it easier on them financially. It allows them grace so that they don't have to try to pay off the debt when they don't have the money to. 6. What does the interest rate depend on? Interest is the money owed for borrowing the money, the rates right now are 4.66% for the Subsidized and Unsubsidized, while the rate for the PLUS is 7.21%. All of these rates are dependent on what the government sets them at. Direct Subsidized Pay Back Cost - I used the Loan Calculator to determine the complete cost of the loan payment with the interest and it came out to be $21,960. So knowing that I used $20,000 the interest I would end up paying would be $1,960. Direct Unsubsidized Pay Back Cost - Again I used the Loan Calculator to determine the complete cost of the loan payment with interest and it came out to a total of $22,899. Knowing I used $ 20,000 in loans, the interest ended up being a total of $2,899. Direct PLUS Pay Back Cost - I used the Loan calculator to determine the cost of the payment again, and it came out to be $23,082 with interest. So knowing again that I borrowed $20,000 in loans, the total interest of the PLUS pay back would be $3,082. Finding inverse and stating its domain. f(x)=3x-2/x+5 I'd switch the x and y and then solve for y. x=3y-2/y+5 x(y+5)=3y-2*y+5/y+5 Once you get the function there you would cancel out the y+5. So once you figure that out you would switch the 5 around to negative 5 and put it where the 3 was. After you do that you would keep everything else, except you put the three in place of the 5. So that would give you f(x) = -5x - 2 / x-3. Once you have the inverse you'd look at the denominator and see x-3. And since you can't have 0 in the denominator you'd know that the domain is All Real numbers except x can't equal 3. f(x) = 2x+3 For this one i would switch the symbols, so i would end up dividing by two instead of multiplying and then i would end up subtracting three. So it would be f(x) = x-3/2. So the domain would be x> -3. Minimum and Maximum with increasing and decreasing. For finding the Increasing and decreasing, you would find the points on the graph. Once you do that, the points that sink low like points A and C would be increasing, because the graph goes up from there, and the points that are up high like point B would be decreasing because the graph would go down from there. As for finding the maximums and minimums it would be the opposite, because the points that are higher would be the highest points on the graph like Point B. While the lowest points on the graph would be the minimums like A and C. So the increasing points and Minimum points would be the ones on A and C, while the decreasing point and maximum point would be the one on B. f/g(x) and f o g(x) f(x) = x^2 g(x) = Sq. root of 9-x^2 x^2/9-x^2 So for this I would plug the square root of 9-x^2 into the x for X^2 and then plug in x^2 into the x of the square root of 9-X^2. Once that is done I would divide from there. and then after I would divide it then I would simplify it to get the final answer. And that would be x or 1. f(g(0)) For solving this, you would plug zero into each function, so (0)^2 and the Sq. root of 9-(0)^2. once you have that you would find the solution which would be three. once I know that solution is three then I would plug that number into the function again to get my final answer. And in the case of this problem it would be f(3)*f(3)^2. The connection between the factors and the zeroes is that when a polynomial is completely factored, the completely factored form's numbers will wind up being the zero. The only thing is that if it was (x-6) , its zero would actually be a positive six. The division will help factor the polynomials, because the number that you use the long division on will be one of the zeros, and you would know that it works by if the solution would end up equaling zero. The degree of the polynomial will help predict the number of zero's, because the power the polynomial is to is usually the same as the number of zeros that you have. This doesn't always work, because you could wind up having one of the factored numbers having a negative too, which wouldn't be counted on the polynomial.
I graphed each function, then looked at the unnecessary parts of the graph, and realized that they could be taken out by finding the domain and range. After I found the domain and range I put them into prentices and once I did that they would be removed from the graph.
A. My prediction for the 7 inch ramp was that it would go about 20 feet per every 5 seconds until it reached 40 feet, and then it would start to decrease, but what actually happened was that the timing was right, but the distance that it made would actually be ten feet further to 50 feet. For the 14 inch ramp I predicted it would reach a max height of 55 feet in around 15 seconds, but I was off by 5 feet and it would actually reach 60 in that span, I also predicted that it wouldn't decrease all that quickly, but it decreased at around 5 seconds faster than I guessed. For the 21 inch ramp I figured that the skateboard would sort of go down gradually and take a similar speed the whole time, but what actually happened was that it went to its peak height of 65 feet then took a sharp decrease all the way back down to twenty in only a 35 second span.
b. The zeros are where the start of the ramp is. c. All the zeros are the same because all the boards start from a stopped position, while all the maximums are different because of the different speeds that they accelerate off the ramp at. d. the higher the slope of the ramp, the quicker the increase and the decrease would be, for instance the 7 inch ramp never got that much speed going down, so therefore it didn't have as much room to decrease in speed.
1.
a. As the day goes on the flag gets higher in the air. b. The rate that the flag moves up slows down until it gets to a point where it stops raising and remains at one height. c. The height keeps getting greater, but the rate slows down quite a bit. d. The flag raises at different speeds at different times and is not always the same. e. The speed it goes at increases gradually to the point where the flag is at peak height. f. Towards the end of the time period the flag height will remain constant. 2. Graph B is most realistic because of the gradual slope that it takes for the flag to reach full height. 3. F is the most unrealistic because it is given no time to raise to its max height. In this lesson i learned the difference between even and odd functions. They are similar because they will both use symmetry, but they are different because they will both be reflected on different axis's , one on the x and one on the y. You would check to see if it's an even or odd by looking at what axis they reflect over, even's being over the x and odds over the y. Another way to check for an even would be to know that every function must have the characteristic that for every -x value, f(-x)=f(x), and if that's not true it wouldn't be even. And for the odds it would have to be for every -x value f(-x)= -f(x). The family of functions that would always be even would be the x to the power family, and there isn't a family that is always odd. Some questions that i still have would be is there a way to know if a function is odd without graphing it?
This graph is an exponential function. I would estimate some of its points at (5, .5), ( 9,2), and ( 15,5).
The Domain is x=all real #'s The Range is y>0 |
AuthorWrite something about yourself. No need to be fancy, just an overview. Archives
November 2014
Categories |